Feb 24, 2024
Mapping Potential Clients
Interactive mapping project for tracking customer locations.
Portfolio Spotlight: Mapbox & Data Visualization
I took on a contract gig at the end of 2023 to build a visualization tool for capturing potential clients for a roofing company. I had the unique opportunity to talk directly with the client (and view past recorded meetings) so I got to hear the problem straight from the user and had the space to decide on the best solution.
I built this dashboard using React/ Remix, Tailwind CSS, Prisma ORM, Planetscale, and MySQL. I used Mapbox API for the map and it was a lot of fun to work with.
The problem statement that I gathered was 1) roofers have access to public records about roofing permits, you can talk to your county and request these docs; but 2) each county has different systems and requirements, so these docs can look really different. 3) As a roofing business, it wouldn't make sense to cold call everyone in your county, you'd want to hone in on people that actually need new roofs (which you can deduce from the roofing permit dates); so 4) they needed a way to parse this data which is usually done by a person, very very slowly, and identify the best people to call who would actually need their services.
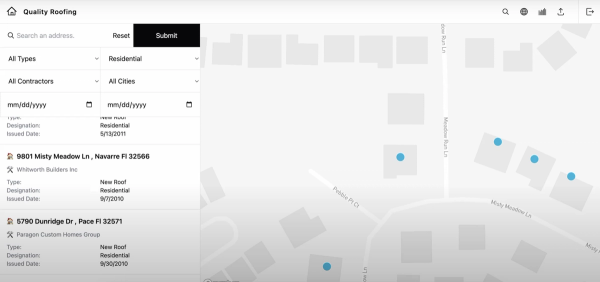
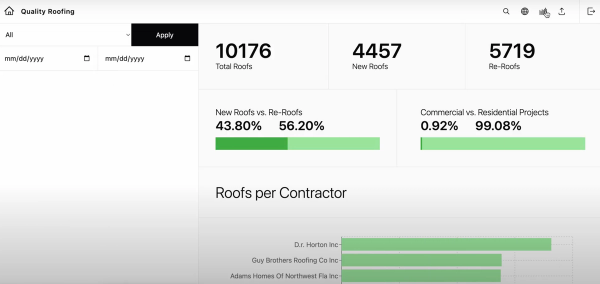
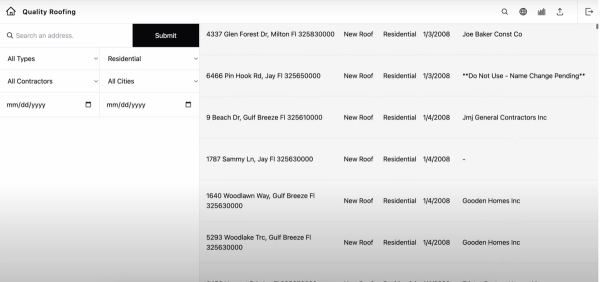
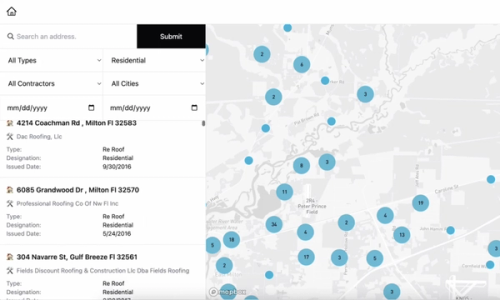
I built a dashboard that allowed them to upload CSVs, map over the columns that they needed (customer contact info, address, dates of permits, who worked on their roof last), then visualize this data as a list and on a map. Using this tool, their staff could then separate out areas for call lists and get those clients!
A few things I thought about - I used the search params to hold filter states, so they could send links back and forth to each other and hold those filters; so they could say I'm calling this list (area A, builder Z, needs roof in next 1 year, etc.). They also wanted a secure platform that couldn't be shared with anyone outside of their organization, so we did Google Auth and only allowed users with their domain to create an account and log in.
Gallery